Some Performance Data on the
Wharfedale W90 Woofers
| This analysis looks at the woofers only
and the difference in their performances.
There is a very detailed
analysis of the W90 called The
W90 Project
A query was noticed in an
audio forum as to the purpose of of the styrofoam. Several replies
stated it was to lower fs. While that is true, there was no
data to show that effect. This presentation attempts to do just that.
|
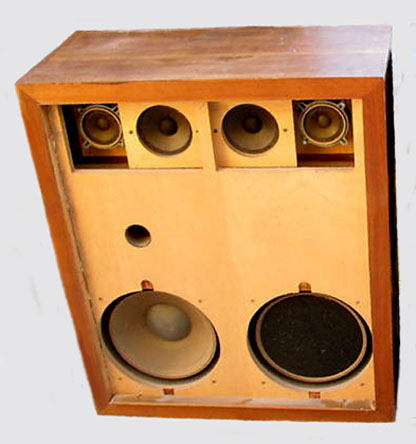
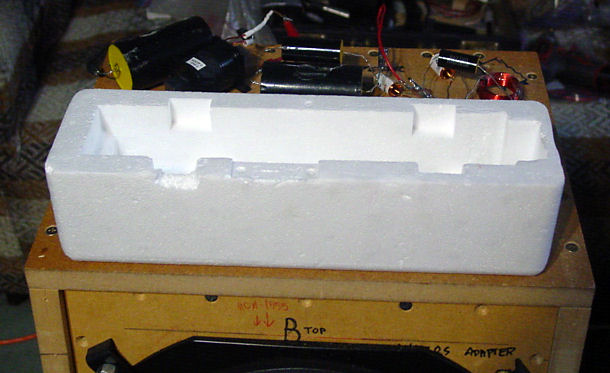
| PHOTO 1
If memory serves me well, the first W90
had the two mids and two tweets floating in the upper chamber. They were
mounted to the back of that chamber by long screws with spacers.
There were four different versions of the
W90. For more on that, see the late Gang-Twanger's post on AudioKarma.
What's
The Best-Sounding Wharfedale W90 Version? Post #1
|
|
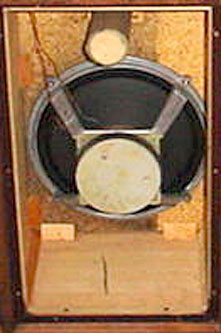
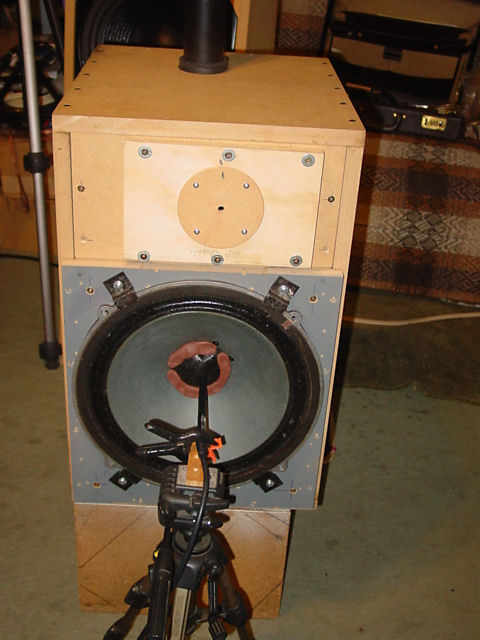
| PHOTO 2
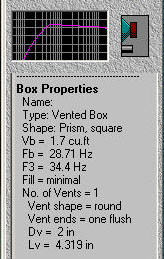
The inside dimension of the chamber is at
least 13". The speaker's basket diameter is 12.375".
Based on this and using the relative dimensions of the width of the
chamber and the inside diameter of the vent from an enlarged photo, the
vent inside diameter was calculated to be about 2.375". It's
length was estimated to be about 6".
It is not known if the vent's being
stuffed was original or done by an owner. |
|
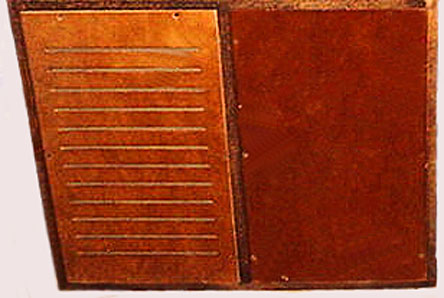
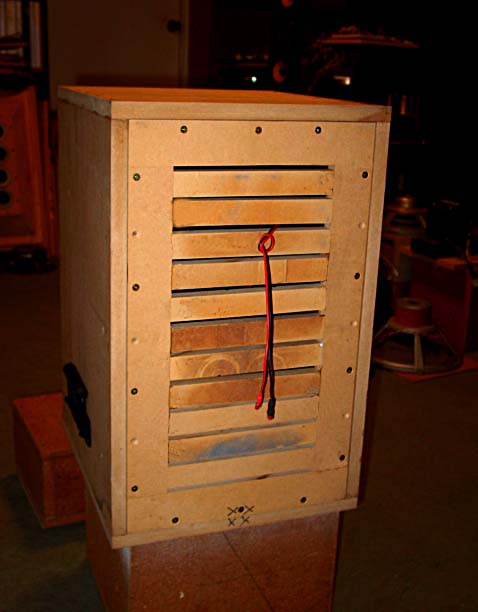
| PHOTO 3
The same method as above was used to
calculate the length of the 12 slots, coming in at 10". Their width
was estimated to be a quarter inch.
|
|
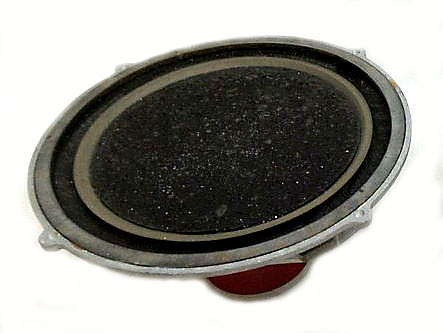
| PHOTO 4
Not having a W12/RS/PST available, the
best thing was to duplicate it, or at least, make an attempt. This was done in a somewhat bizarre
manner, albeit creative.
The trick was to find the mass of the
polystyrene (PST) in the cone of a W12/RS. The mass of the polystyrene
packing block below is 32g. It has a volume of 85 in^3, giving a density
of 0.3764g/in^3. The volume of the frustum of the cone is 81.5in^31.
This gives a PST mass of 30.68g. Sticking 32g of clay to the cone
apex around the dust cap and measuring the Thiele-Small parameters
should give a close approximation to the actual speaker. This is
assuming the cone and coil are then same as the W12RS and given the name
being the same as the PST unit with the addition of PST, (bung, as Gilbert Briggs called it),
it seems like a very
safe assumption to make.
To quantify errors in the PST mass, a 20g
mass of clay was also used to measure Thiele-Small parameters for
comparison. See Fig. 1 below.
The volume, V, of the frustum of
a cone is given by
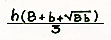
where B is the larger area, b is
the smaller area and h is the perpendicular height from B to b.
|
TABLE 1
Here's some data. The only
difference is fs
From "A Pair of Wharfedales" page
200 ISBN 978 -1 - 906715 -14 - 4
| Speaker |
Fs |
Flux |
Total Flux |
Pe(RMS) |
Weight |
Basket Diameter |
Depth |
Baffle Opening |
|
Hz |
Oersteds |
Maxwells |
Watts |
Pounds |
Inches |
Inches |
Inches |
| W12/RS |
45/50 |
14000 |
156000 |
15 |
12 |
12.375 |
5.25 |
10.875 |
| W12/RS/PST |
26/32 |
14000 |
156000 |
15 |
12 |
12.375 |
5.25 |
10.875 |
1 Maxwell = 1 Gauss/sq.cm. = 1 Line
1 Gauss = 1 Gilbert/cm. = 1 Line/sq.cm.
= 1 Maxwell/sq.cm. = 10E -0.4 Tesla (0.0001T)
1 Tesla = 10,000 Gauss = 3937.25
Lines/sq.cm.
W12/RS manufactured 1961-1962 +/- 1 year
W12/RS/PST manufactured 1962-1965 +/- 1
year
| The
W12/RS with 32g clay stuck to the cone and the rear with the 12 slots.
The Thiele-Small parameters were measured
using the delta-mass method. Two impedance curves are obtained both with
the 32g but the second with an additional 25g. From these curves, the
Thiele-Small parameters of the weighted cone can be derived.
Prior to 1994, these parameters were
derived manually, a tedious process. Later, a computer program was
written in BASIC which sped up the tedious calculations and eliminating
errors once the program was de-bugged. Any errors thereafter were due to
careless data entry or careless reading on a squiggle tube.
(oscilloscope)
|
| PHOTO 5
|
PHOTO 6
|
PHOTO 7
A photo of the W12/RS/PST found on the net
Now for some data from Bass Box
Pro, ver.6
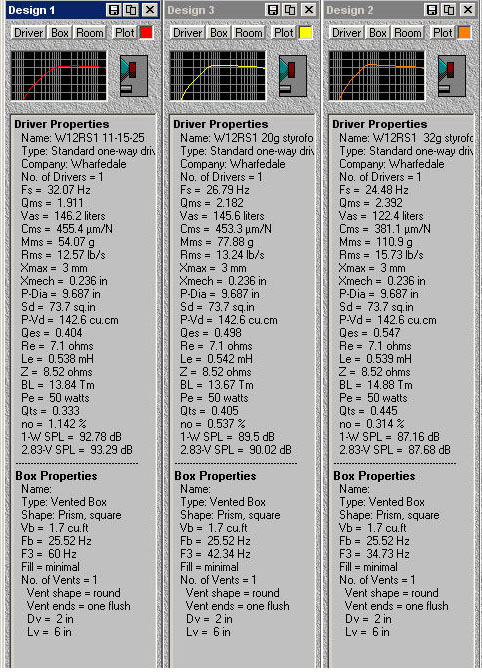
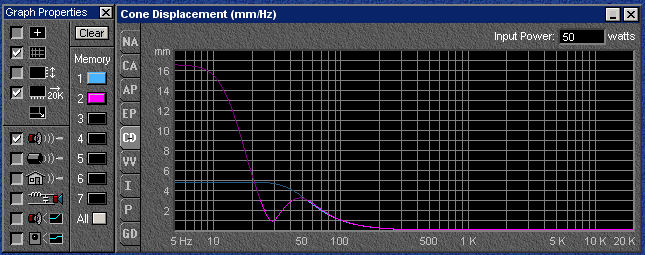
| FIGURE 1
Here we have the Thiele-Small parameters
of the W12/RS(red), W12/RS with 20g(yellow) and W12/RS with 32g(orange)
As expected, the most obvious parameter
to change was Fs, along with F3. All speaker cabinet volumes are set at
1.7ft^3 which is the estimated volume of each W90 chamber and the
vents were all set at 2" diameter and 6" long. The chamber
volumes were
also calculated as described above in photo 2.
It should be noted that vents with
diameters of 2.0" and 3.0" were also used in
Bass Box Pro for comparison with very little difference in responses
calculated by Bass Box. The 2.0" vent was used as that was
readily available and closer to the original, especially regarding its
length. A 3" vent would be longer and too close to the back panel. |
|
|
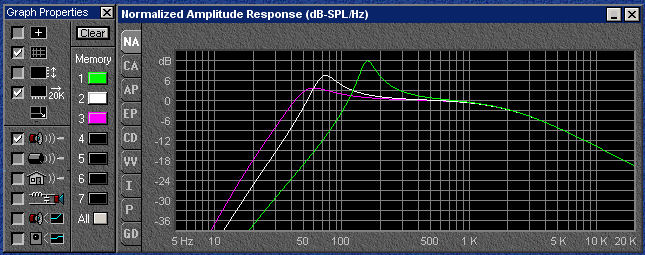
FIGURE 2
Normalized amplitude
responses of the above three designs as described in fig.1 above

|
|
FIGURE 3
Amplitude responses at 50
watts. It can be seen how the added mass affects the output, especially
in the low bass between about 55hz and 100hz, where the loss in output
can be around 3dB to 6dB. Perhaps that is the function of the impedance
matching transformer but, unfortunately, no schematic of the W90
crossover with that transformer has been found. There have been found
many photos of the W90 crossover showing the transformer but those
photos left a lot to be desired as to how the transformer was wired
into the crossover.

FIGURE 3a
|
|
FIGURE 4
Here we have the maximum
acoustic power available due to the added mass on the woofer. The 3dB to
6dB variables can easily be seen.

|
|
FIGURE 5
Again, the losses due to
the added mass. It appears that the added mass permits the speaker to
handle more power input before reaching Xmax. While this may seem like a
perk, the caveat is a higher drain (load) on the amplifier, with the
risk of driving it into clipping.

|
|
FIGURE 6
This shows cone
displacement at 50 watts. It does moderately exceed Xmax but given that
Xmech is about 6mm, the speaker seems safe. However, there are
assumptions made here. Bass Box Pro has no idea as to how far the
suspension can be driven. It makes calculations based on Mms and Cms,
the mass of the moving part of the system and the compliance (stiffness)
of the suspension. The magnetic flux density is also considered in these
calculations. While this may be safe when the system is new, Cms will
change over time.
Xmax was determined by
driving the speaker to the point of producing a gross non-linearity
between current applied to the voice coil and diaphragm excursion. For
example, a current of X amperes causes the diaphragm to move a distance, D.
Two amperes will cause the diaphragm to move a little less that 2D and 3
times the current will cause the diaphragm to move even less.
It's Hooke's law

|
|
FIGURE 7
Vent air velocity is
within limits even for a 2" diameter vent. If one were to
drive the speaker at 50 watts below 30hz or 40hz, the sounds of anything
moving in the room due to not being nailed down would mask any sound produced by air
moving through the vent.

|
|
FIGURE 8
Woofer impedances. The use
of the word system implies inclusion of the high frequency
drivers and the crossover but is not the case. Here's it's the woofer
impedance in the chosen cabinet volume.

|
|
FIGURE 9
Phase response, the
difference, expressed in degrees, of the input signal to the acoustical
output signal of the loudspeaker. This is most important at a crossover
frequency between two adjacent drivers. If one is out of phase by a lot
to the other, a notch will appear in the response. If
the two drivers were 180 degrees out of phase, a null would be created.

|
|
FIGURE 10
Group delay, phase
response expressed as a function of time, here in milliseconds. If
present, it worsens at lower frequencies. It can go unnoticed unless one
is watching video, as synchronization between what one sees and hears
will be different. For instance, speech would be heard after the lip
movements. A drum sound will be heard after the drum stick strikes the
drum skin. Also, too much delay will negatively affect transients.

|
|
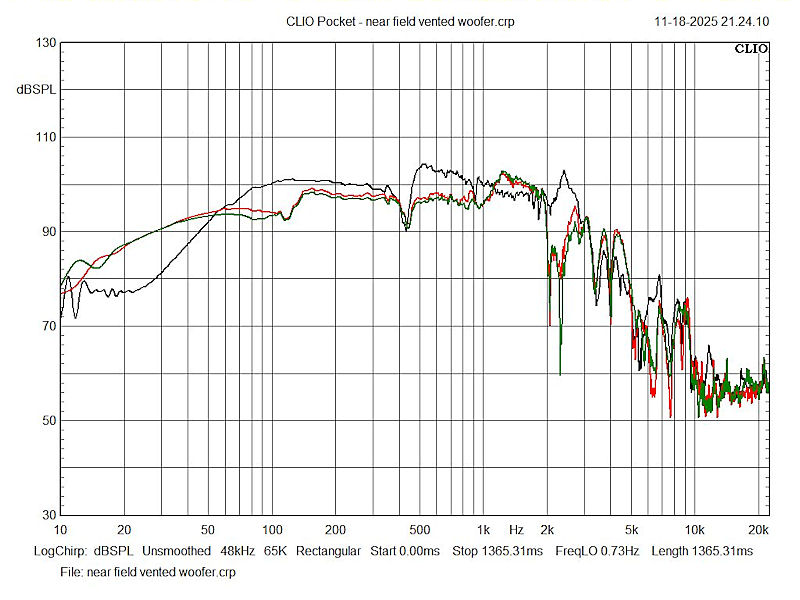
FIGURE 11
Near field responses
RED-slotted
back 20g GREEN-slotted back 32g
BLACK-tubular vent 2"D by 6"L no added mass, 0g
As can be seen, the red
and green curves of the mass loaded woofer show better below 55hz and
are very similar, their difference being attributed to the 12g
differential. The
several dB loss above 55hz and to about 1khz is compensated by the
unloaded woofer, black curve, the one with the rapid downward slope
below 100hz.
|
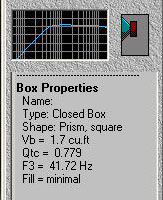
Initially, the mass loaded woofer
was in a sealed chamber. Later, a tubular vent was used followed by the
multi slotted vent. The following alignments are with the added 32g on
the cone to simulate the polystyrene bung. Blue is closed, pink is
tubular vented. The slotted vent will be discussed later. Note the
difference in F3
FIGURE
12a
FIGURE 12b
|
| FIGURE
13
As expected, the vent
loaded box gives a higher bass output, the amplitude and width of which
can be adjusted by the vent. The compromise usually manifests itself in
diaphragm excursion.

|
| FIGURE
14
Maximum electrical input
to the speaker before exceeding Xmax. As the frequency lowers, the
effect of the air mass behind the diaphragm decreases. The air mass
oscillating in the vent will act as a shock absorber at lower
frequencies. The tradeoff is is less damping, compromising transient
response, which is usually considered to be of less importance due to
subjectivity.

|
| FIGURE
15
At 50 watts, cone
displacement, theoretically, well exceed Xmax by a little less than half
a millimeter. However, Xmax is considered to be the point at which
nonlinearity of cone motion becomes excessive. see figs. 20-23
|
| FIGURE
16
see fig. 9 above

|
| FIGURE
17
see fig. 10 above

|
Color
references are the same as in fig 11
|
FIGURE
18a

|
The
Mystery of the Slotted Vents
This posed a confusing
situation. The calculated response curve, green, bears no similarity to
the actual near field response of fig.11. Assuming the stuffed vent seen
in photo 2 to be as manufactured, a similar blocking of the slotted
vents was considered. Not having seen the inside of the W90 slotted back
panel, the best that could be done to restrict the slotted vents was to
make them smaller and let Bass Box model the result, which can be seen
in figs.18b and 18c.
I recall seeing a photo
of the innards of the W90 slotted back and it was covered with a sheet
of compressed wool about 5/8" to 3/4" in thickness.
|
|
FIGURE
18b

|
FIGURE 19
|
|
FIGURE
18c

|
Restricting
air flow through the vents approaches a sealed box. See fig.12a. This
can also be done with a tubular vent which leads one to think that the
slotted vents may have been a marketing strategy although it looks like
the Briggs' patented acoustic filter.
That filter was used in
very early ported bass enclosures, one which can be seen HERE
|
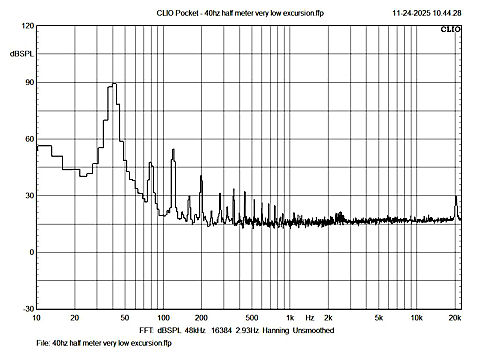
The
following 4 figures are spectrograms taken at 40hz, from top to bottom,
barely visible excursion, 1mm excursion, 4mm excursion and 6mm
excursion. The distance of the mic from the speaker was one half meter. The SPL shown would be 6dB lower at one meter.
These
distortion measurements are not made under anechoic conditions and are a
very rough guestimate. Their purpose is only to show how distortion
rises with amplitude. It should be noted though, that we don't listen to
music under anechoic conditions so the distortions shown here are
actually what we hear. This may be the reason why so many people I've
met years ago claimed that concert halls are bass deficient.
The
increase in distortion versus amplitude is clearly visible.
Distortion percentages are estimated between the peak at the fundamental
and the next largest peak just above 100hz. The actual total distortion
would obviously be higher.
Note the
extreme rise in distortion when the speaker is driven beyond Xmax, in
this case to its limit, Xmech, 6mm. fig.23
Percentages
are derived using sengpielaudio
FIGURE
20 1.4%
|
FIGURE
21 4.5%
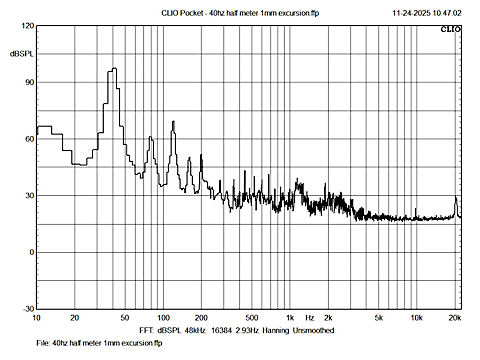
|
| FIGURE
22 7.1%
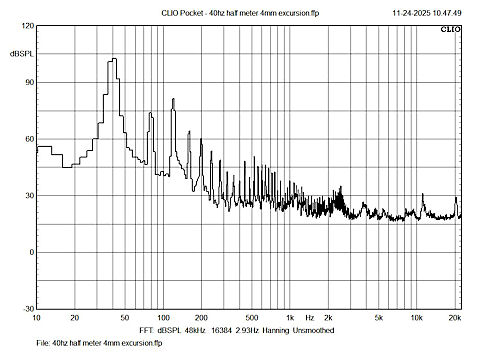
|
|
FIGURE 23
22.4%
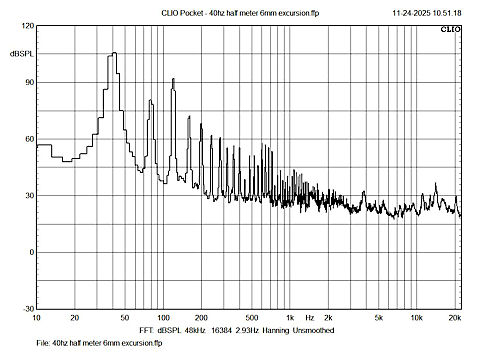
|
Back
to the Wharfedale Index
Back to
the loudspeaker main page